BDSwiss App
Download & start trading

Rates as of 05:00 GMT
Did you see the total eclipse of the moon this morning? I’ve never seen one before so I got up at 4:30 AM, when it was supposed to be just starting, to check it out. Nothing. Went back out at 5:10: nothing. Went back at 5:30, when it was supposed to be at its peak, but the moon was no longer visible at all. Either it had set already or the sky was too bright. Oh well.
Market Recap
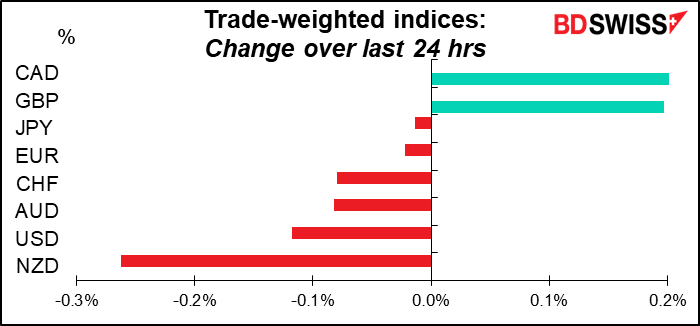
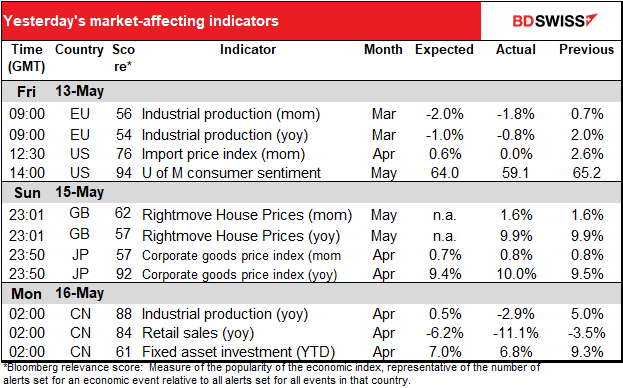
After several days of extremely volatile currency markets, Friday was relatively quiet. Perhaps it was the absence of much news during the day. The University of Michgan consumer sentiment index fell much more than expected (see table above), but that didn’t seem to impact the markets much – the S&P 500 finished up 2.4% anyway.
But the mood turned sour in Asia this morning as the Chinese data came out much worse than expected (see table again). This has rekindled fears over global growth.
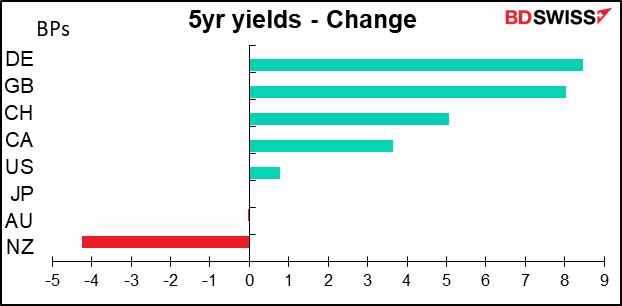
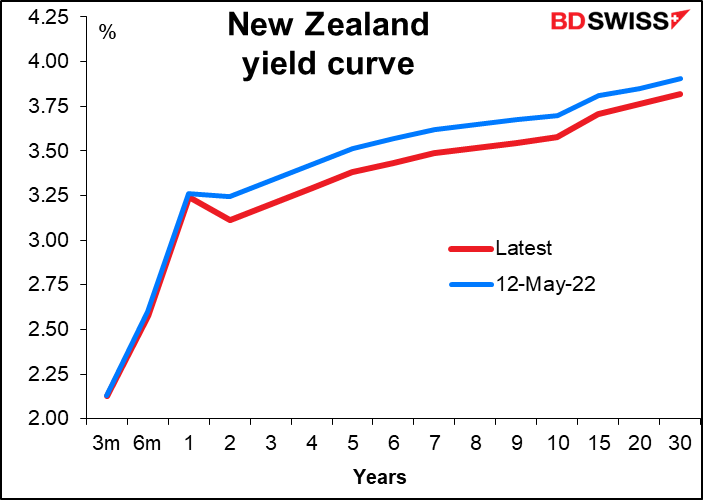
NZD was the worst-performing currency. NZ bond yields fell sharply Friday.
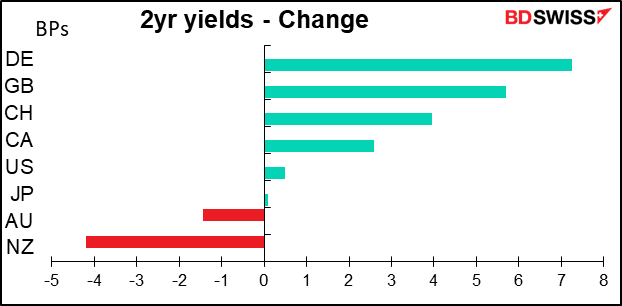
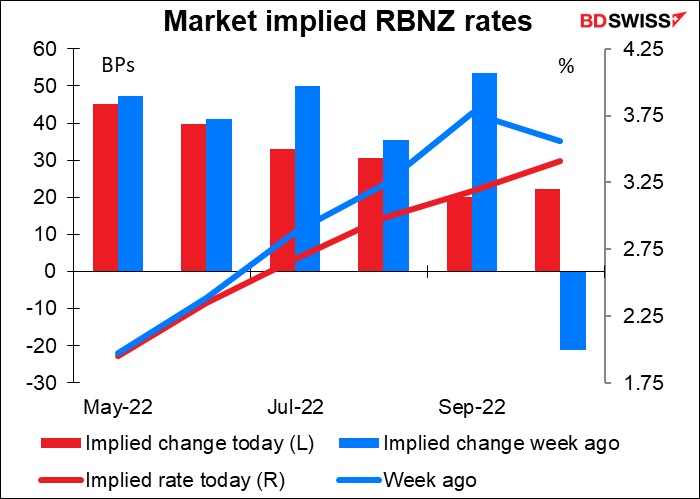
The market has started to question the aggressive rate hike profile that’s been assumed for the RBNZ given growing questions about the global economic outlook and evidence of a sharp slowdown in the NZ housing market. The market still prices a high chance of a 50 bps hike at next week’s meeting and the July meeting, but the implied probability of 50 bps move at subsequent meetings has been pared back.
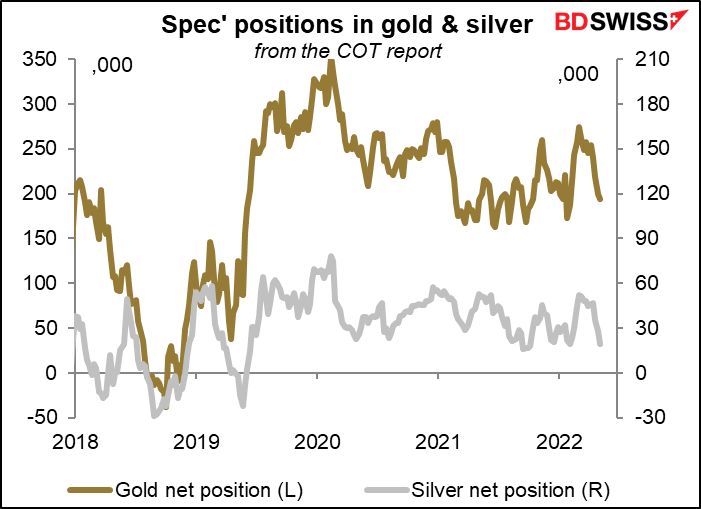
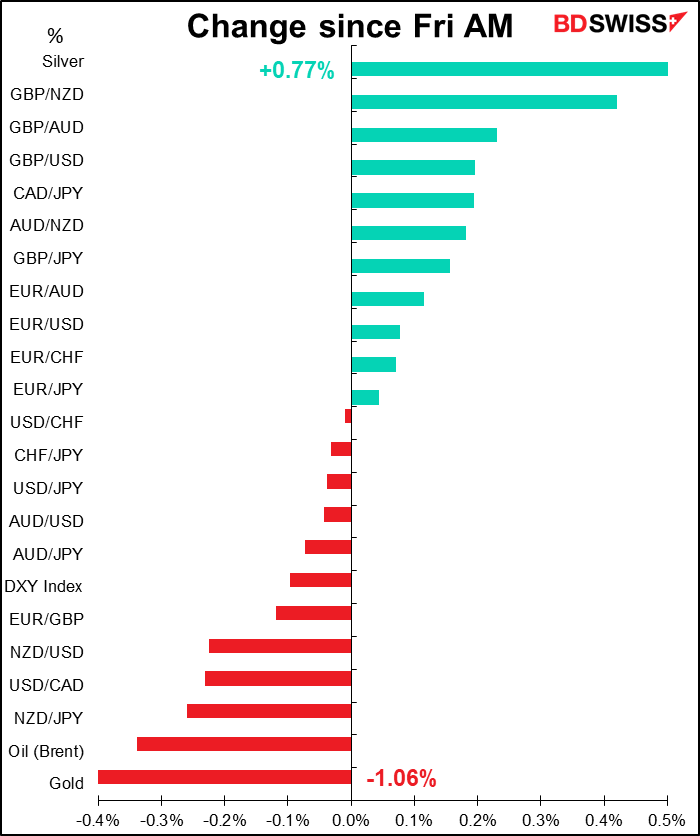
It’s noticeable on the table at the bottom of this comment that gold was at the bottom while silver was at the top. I don’t have an explanation for this. It’s not unusual for the two metals to move in opposite directions but it is unusual for them to be at opposite ends of the spectrum like this.
Commitments of Traders (CoT) report
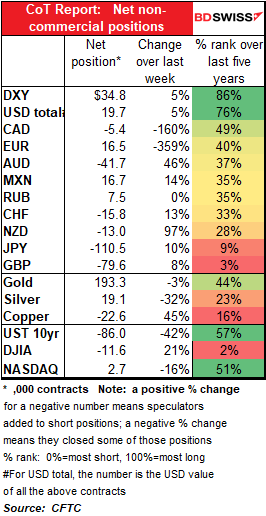
Once again, relatively little change in speculators’ overall position. Slightly longer USD but not significantly.
The biggest change was yet another flip in EUR positioning, from net short to net long. At the same time they flipped from net long CAD to net short. Otherwise, most of the changes consisted of speculators increasing their short currency positions (NZD, CCHF, AUD, GBP, and JPY). That’s probably the most significant sign – not the overall change in dollar positioning but the fact that they increased their short position in most currencies except EUR.
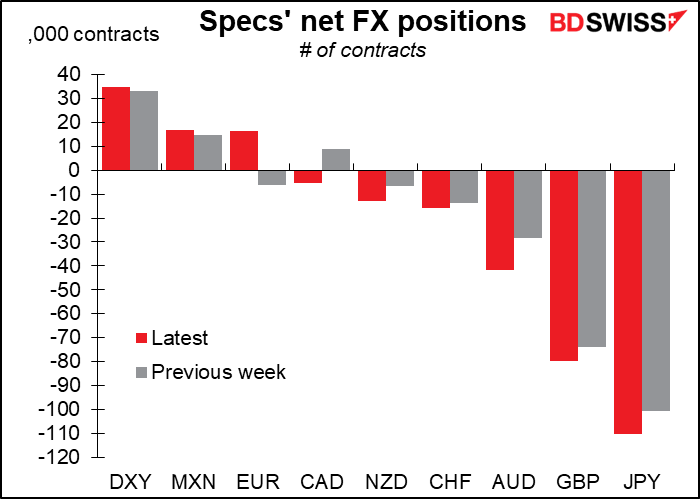
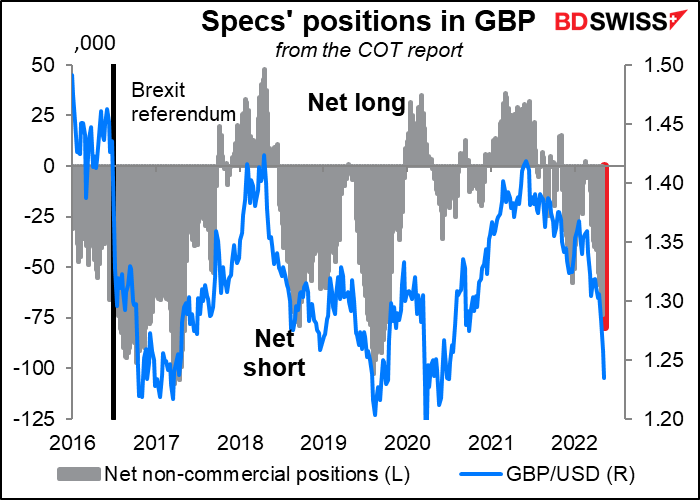
Speculators’ position in GBP is getting rather extreme. They’ve only been this short 3% of the time over the last five years. There could be a snap-back if anything good happens for the pound. My guess though is that only bad things are going to happen in the near future, especially when it comes to the looming fiasco over the Northern Ireland Protocol.
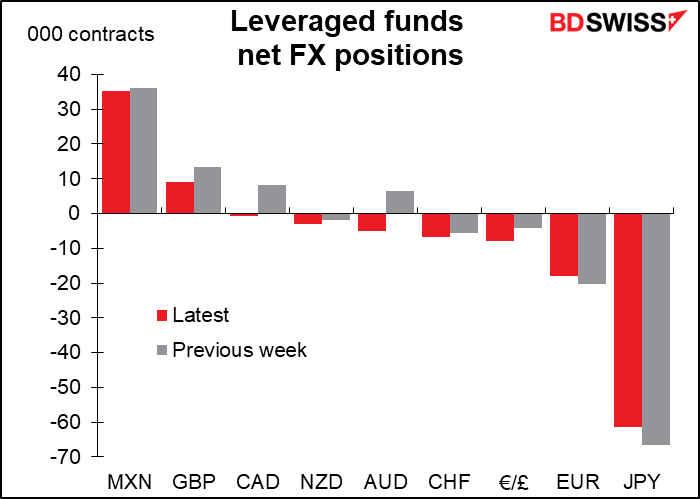
Hedge funds were a bit more selective. They too flipped to short CAD from long and also flipped to short AUD from long. On the other hand they trimmed their short EUR and JPY positions.
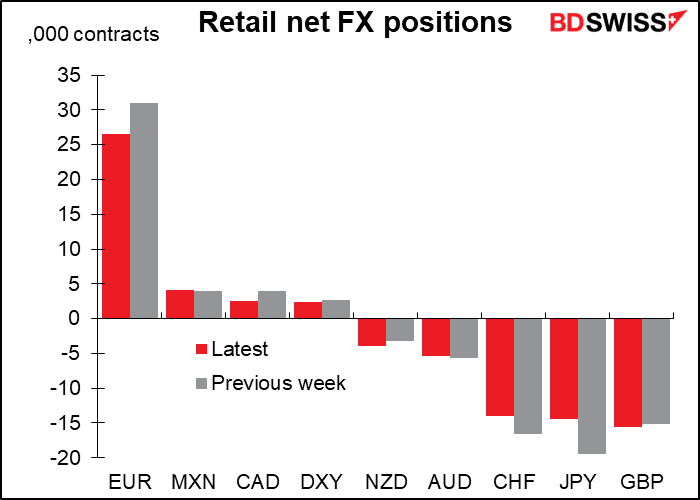
Retail investors went the opposite of speculators with regards to the euro and trimmed their long position. They also trimmed their long CAD position, going along with the generally more bearish outlook for CAD. They also trimmed their short CHF and JPY positions. GBP is now their largest short.
Precious metals: speculators continued to cut their long positions in gold and silver. The PMs just can’t find any love despite the higher inflation.
Today’s market
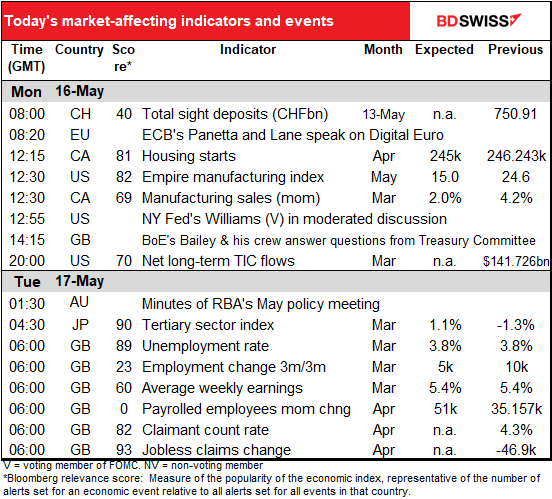
Note: The table above is updated before publication with the latest consensus forecasts. However, the text & charts are prepared ahead of time. Therefore there can be discrepancies between the forecasts given in the table above and in the text & charts.
Let’s get started!
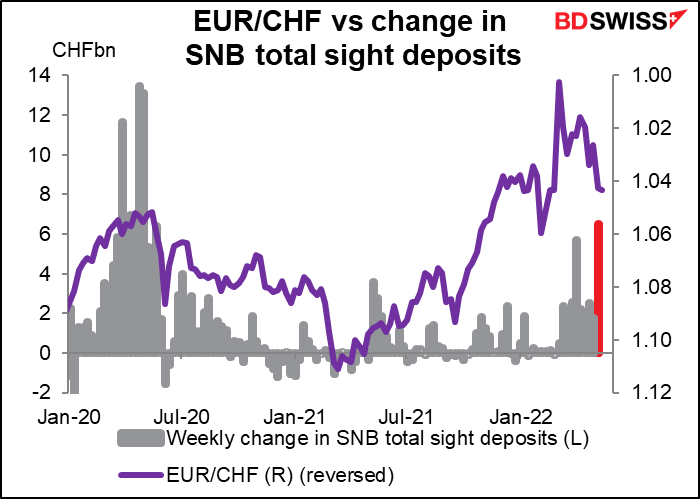
The European week starts off as usual with Swiss sight deposits. Last week sight deposits rose by CHF 6.5bbn, the largest increase since the first days of the pandemic. This intervention may explain the recent weakness of CHF vs USD and JPY.
That’s about it during the European morning. ECB Executive Board member Fabio Panetta and Chief Economist Philip Lane speak on a panel at the “Toward a Digital Euro” event organized by the Irish Senate. The event will be livestreamed if you’re interested.
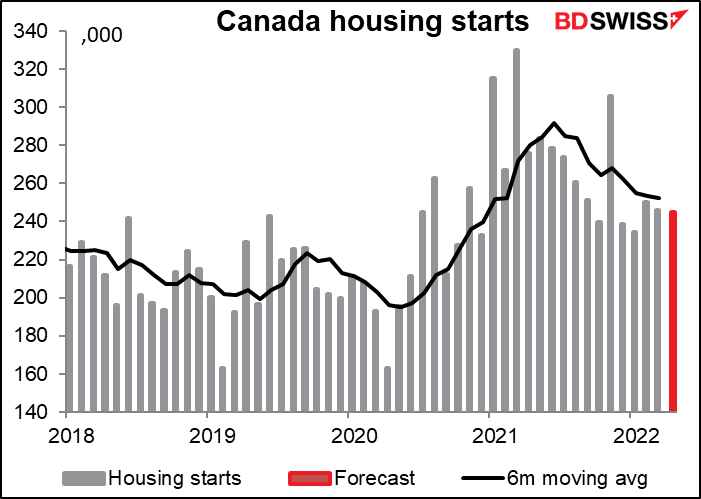
When the North American day starts up, Canadian housing starts are expected to go sideways. This should come as no surprise. The statement following the April Bank of Canada meeting said, “Housing market activity, which has been exceptionally high, is expected to moderate.” So it’s moderating. No impact likely.
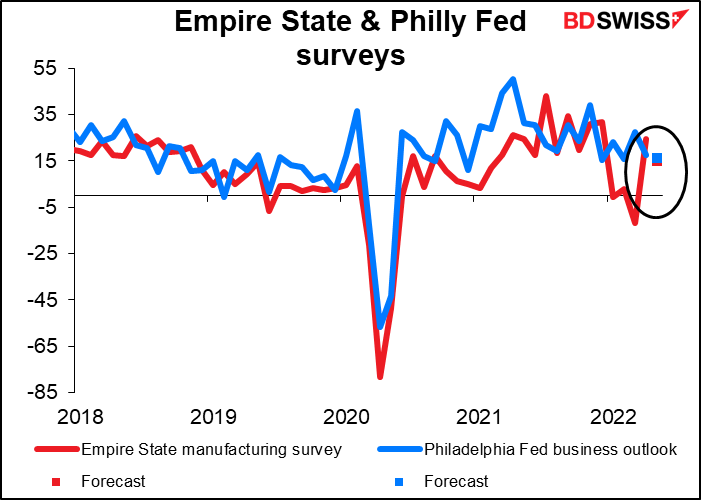
The Empire State manufacturing survey starts off the regional Fed surveys for May. As usual, the market is expecting convergence with the Philadelphia Fed business survey, due out on Thursday. This time though both are expected to be down, the Empire survey by a lot (-9.6 points) and the Philly Fed survey by a little (-1.1 point). Note though that both are still expected to remain well in growth territory. This by itself could be positive for the dollar.
During the European afternoon, Bank of England Gov. Bailey and Deputy Gov. Sir Dave Ramsden, plus Monetary Policy Committee members Johathan Haskel and Michael Saunders will give “oral evidence” (??) to the Treasury Committee on the recent Monetary Policy Report. (I’d use the word “testify” myself, but I’m not a bureaucrat.) Haskel and Saunders both voted for 50 bps increases at the last meeting so the market will pay particular attention to their “oral evidence” to see if they still feel that way.
Overnight, the Reserve Bank of Australia (RBA) will release the minutes of its April policy meeting. This was the meeting where they threw in the towel and hiked the cash rate by 25 bps to 0.35%, an outcome that nobody anticipated (everyone who expected a change thought it would be either 15 or 40 bps, which would have brought the cash rate back to its usual 25 bps interval.) In his press conference following the decision, RBA Gov. Lowe described the 25 bps hike as a return to “normal operating procedures.” The market will be looking for some more detailed explanation of why “normal operating procedures” refer to the change in the policy rate, not its level. The Bank of England for example hiked 15 bps in December to get its Bank Rate back to the usual 25 bps interval (0.25% in this case). That’s what the market assumed “normal operating procedure” would be. The RBA’s thinking in this matter is important because it will help people to forecast what the RBA is likely to do from here. Do they want to restore the pre-Covid level convention of setting the rate at quarter-point intervals (25, 50, 75, etc) or are they focused on the size of the hike each time and likely to stick with 25 bps or 50 bps hikes during this cycle?
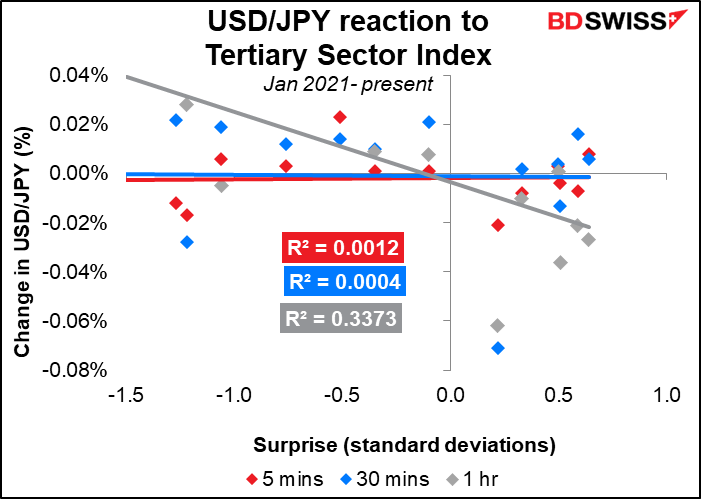
Japan’s tertiary sector index has a high Bloomberg relevance score but isn’t so important for the FX market.

The market doesn’t seem to react to the index until about an hour after its release. That could provide some trading opportunities.
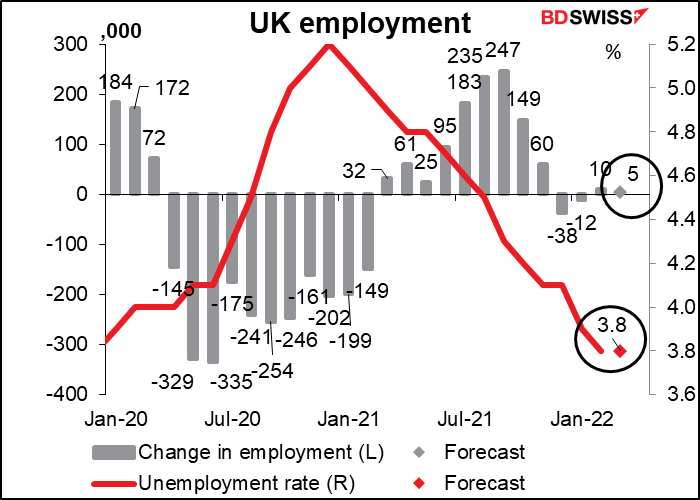
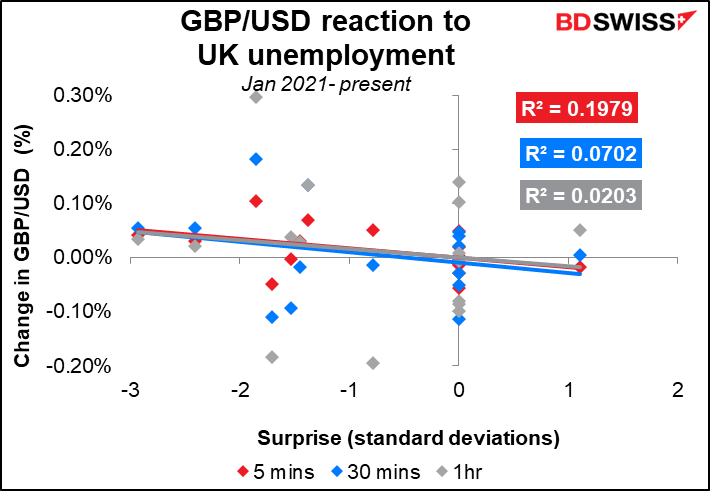
Then, early Tuesday, Britain releases its employment data. The market is looking for the unemployment rate to stay at 3.8% while a mere 5k new jobs are forecast. There’s been hardly any change in the number of jobs in the last several months.
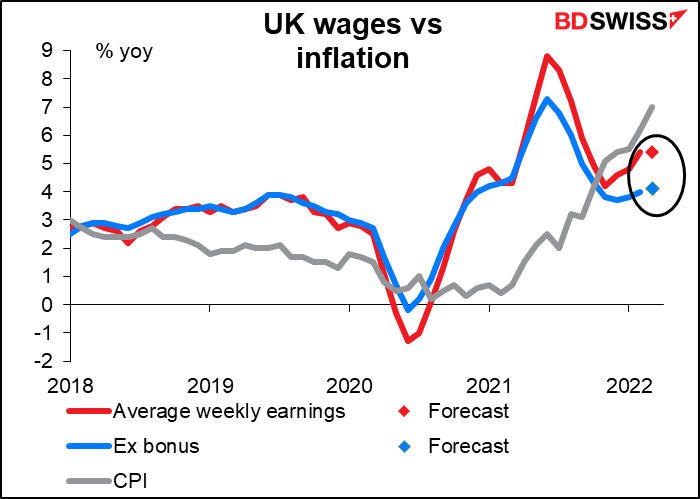
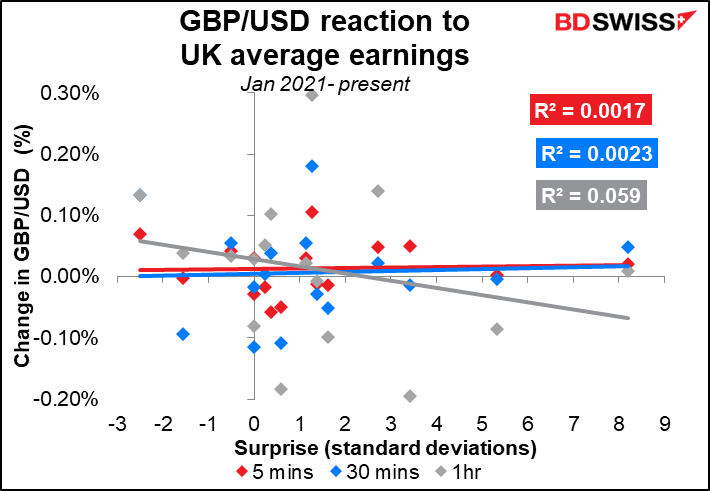
Average earnings are expected to go up, but not by more than the inflation rate, thank heaven! I’m sure Bank of England Gov. Bailey will be delighted to know that workers are exercising “restraint,” as he asked, and allowing their earnings to be eroded by inflation after years of having their savings eroded by negative interest rates. They must be delighted with the Bank’s stewardship!
Although the data are major economic indicators, neither the unemployment rate nor the average earnings figure has that much of a direct and predictable impact on the exchange rate. Note that the unemployment rate often hits the market forecast; I tried running the calculation without those instances and got pretty much the same result. It does appear that GBP tends to rise when unemployment misses the forecast (i.e. unemployment is lower than expected), which is what one would expect, but the correlation isn’t that strong.
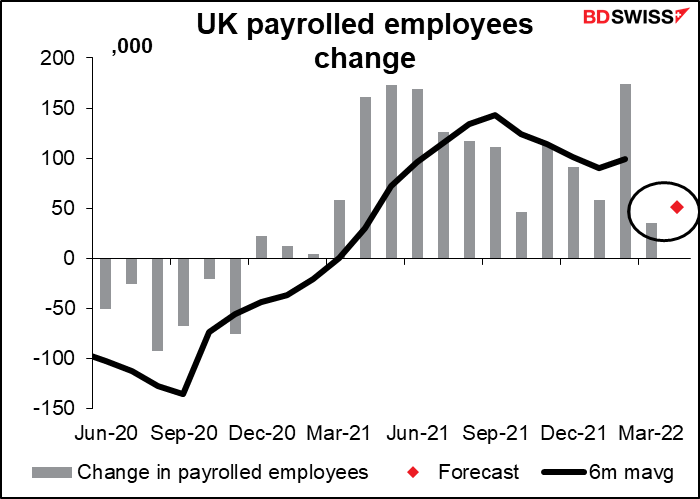
The number you really should be watching is the change in payrolled employees. The Office of National Statistics only started reporting it this year, which is why the Bloomberg relevance score is zero. But don’t let that fool you – it’s the most important figure here, for two reasons. One, it’s early – this is data for April, whereas the unemployment rate and all the rest are for March. Secondly, it’s also more accurate than the other data as it’s not estimated from a sample but rather comes from the records of everyone paying withholding taxes, i.e. every person on a payroll in the country. It’s the UK equivalent of the US nonfarm payrolls and should eventually earn the same status.
It’s expected to show a bigger increase in employment than in the previous month, probably because the country no longer has much of any COVID-19 precautions in place. This could be modestly positive for GBP.
 Marshall Gittler
Posted on 25 April, 2024 at 15:14 GMT
Posted on 24 April, 2024 at 15:53 GMT
Posted on 23 April, 2024 at 11:46 GMT
Posted on 22 April, 2024 at 14:46 GMT
Posted on 19 April, 2024 at 13:15 GMT