BDSwiss App
Download & start trading

Previous Trading Day’s Events (23.04.2024)
______________________________________________________________________
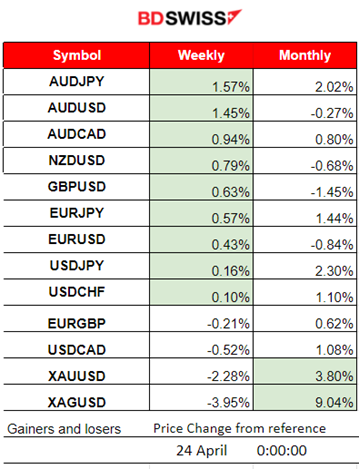
Winners vs Losers
AUDJPY is on the top of the weekly list of gainers with 1.57% gains. Silver re-gained some of the performance yesterday reaching 9.04% again for this month and leading.
 ______________________________________________________________________
News Reports Monitor – Previous Trading Day (23.04.2024)
Server Time / Timezone EEST (UTC+03:00)
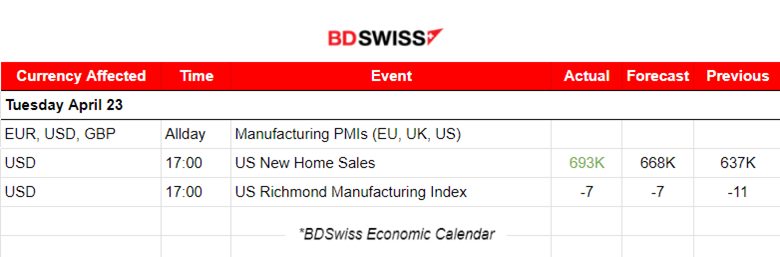
No special news announcements, no major scheduled figure releases.
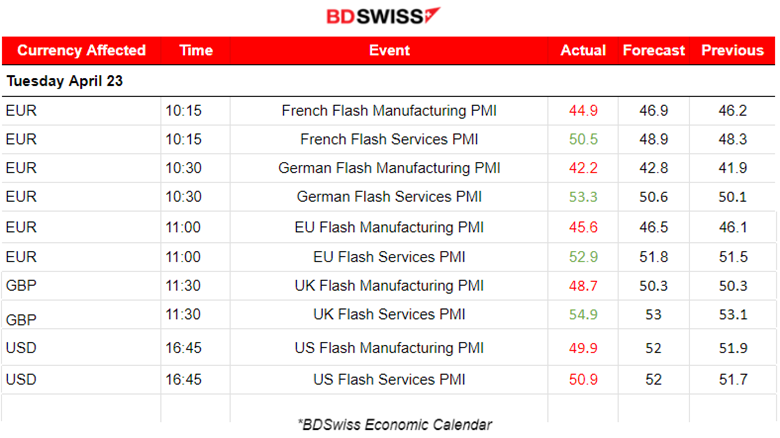
The Manufacturing and Services PMI figures:
 Eurozone PMIs:
The French economy stabilised in April as renewed expansion in services activity offset the manufacturing sector contraction. The reported PMI in Manufacturing worsened to 44.9 but the services PMI turned to the expansion area with a reported PMI at 50.5 points. Private sector output levels remained unchanged from those seen in March. Services business activity increased for the first time since May 2023.
The German business sector returned to growth at the start of the second quarter driven by growth in services business activity. The manufacturing PMI remains in contraction while the services sector PMI reported a significant improvement to 53.3 points, turning in expansion. Although manufacturing remained in contraction, the rate of decline in factory production eased and confidence amongst goods producers towards the outlook reached the highest for a year.
The Eurozone PMI for services was reported improved. It shows that the economy is gearing up for an acceleration in activity after a year and a half of broad stagnation. It helps the EUR. However, that would be enough for a change in inflation expectations and a change in the ECB’s thinking about cuts? If we look at the U.S. the PMIs are not improving. This could be a signal of a downturn in U.S. growth and would suggest that the upcoming data will not be as great for the U.S. as before. Inflation obviously will be hard to bring down and the Fed will get even more puzzled on what to do in regards to future interest rate policy.
U.K. PMIs:
The U.K. experiences the fastest expansion of output since May 2023. The private sector activity expanded for the sixth consecutive month in April as a robust recovery in service sector output helped to offset a marginal decline in manufacturing production. Output growth from an upturn in new order volumes driven by the service economy. The services PMI reached, remarkably, to 54.9 points.
United States PMIs:
In the U.S. business activity expanded in April at the slowest pace this year on a pullback in demand that led to the first decline in employment since 2020. The services PMI was reported to worsen at 50.9 points. Orders showed contraction. The group’s measure of employment slid 3.2 points to 48.
General Verdict:
 __________________________________________________________________
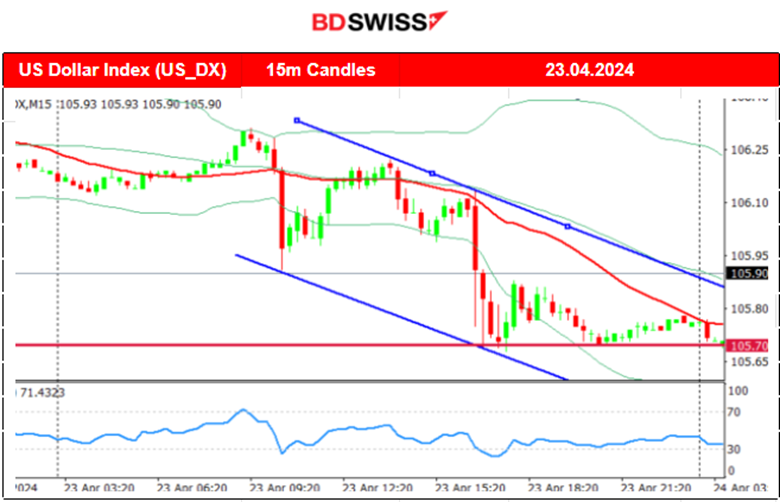
FOREX MARKETS MONITOR
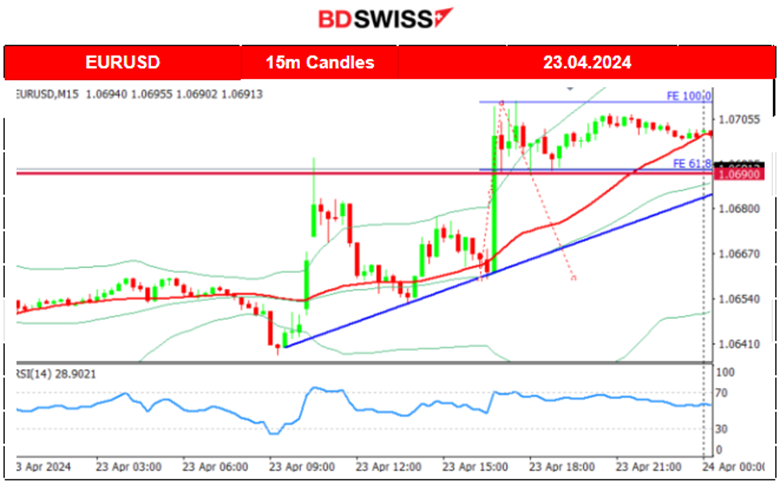
EURUSD (23.04.2024) 15m Chart Summary
Server Time / Timezone EEST (UTC+03:00)
Price Movement
The pair obviously was experiencing upward shocks intraday during the PMI releases for the Eurozone. It seems that the USD was affected negatively during the releases causing these occasional jumps of the EURUSD pair. The EUR was also appreciating on every release adding to the jumps. PMI data showed that business conditions are improving due to the services sector that turns to expansion.
 ___________________________________________________________________
CRYPTO MARKETS MONITOR
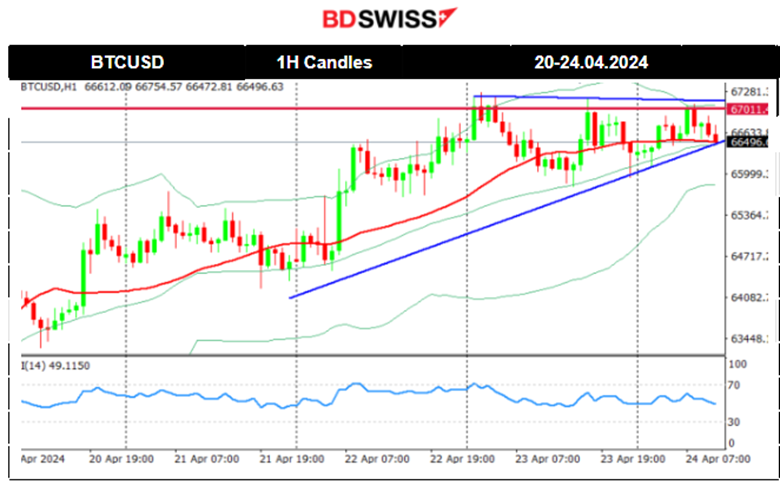
BTCUSD (Bitcoin) Chart Summary 1H
Server Time / Timezone EEST (UTC+03:00)
Price Movement
Bitcoin halving took effect late on Friday 19th April, cutting the issuance of new bitcoin in half. It happens roughly every four years, and in addition to helping to stave off inflation, it historically precedes a major run-up in the price of Bitcoin.
Its price started slowly to move to the upside and experienced an uptrend during the weekend. Since the 20th of April, the price moved to the upside post-halving. Bitcoin was on an uptrend with the price moving within a channel. Since the 23rd upside slowdown took place as volatility levels lowered forming a triangle, trading around the 67K USD level. Now it is a matter of which direction the breakout will take place.
Source: https://www.reuters.com/markets/currencies/crypto-fans-count-down-bitcoins-halving-2024-04-19/
 Crypto sorted by Highest Market Cap:
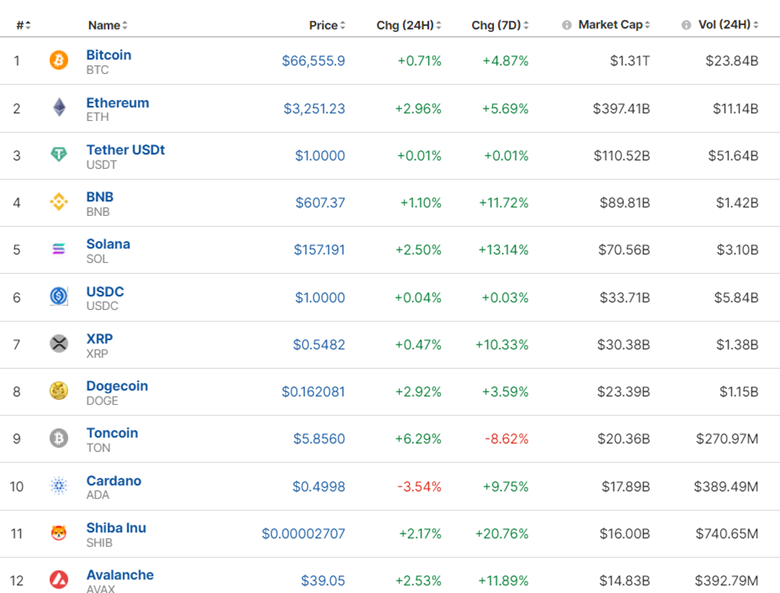
The market seems to have picked up traction as the Bitcoin halving took place. Despite the event, it’s unclear whether it will lead to a price jump as it has in the past. The latest performance however for the last 7 days is actually good as seen above. Shiba Inu gained over 20% during that period.
Source: https://www.investing.com/crypto/currencies
______________________________________________________________________
EQUITY MARKETS MONITOR
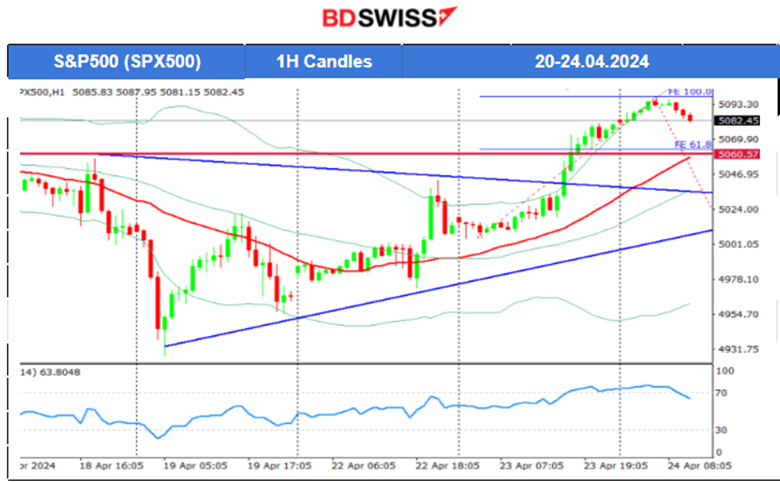
S&P500 (SPX500) 4-Day Chart Summary
Server Time / Timezone EEST (UTC+03:00)
Price Movement
The index was on a downtrend recently as borrowing costs are expected to remain high, plus geopolitical tensions having an impact on expectations and a change to a risk-off mood. Breakout to the upside and of the 5,000 USD level led to a jump of 30 USD on the 22nd of April and a retracement took place soon after. This eventually was the start of an uptrend as mentioned in the previous analysis. The resistance of 5,040 USD tested again and the breakout that followed caused the price to reach 5,095 USD before retracement took place on the 24th of April.
 ______________________________________________________________________
COMMODITIES MARKETS MONITOR
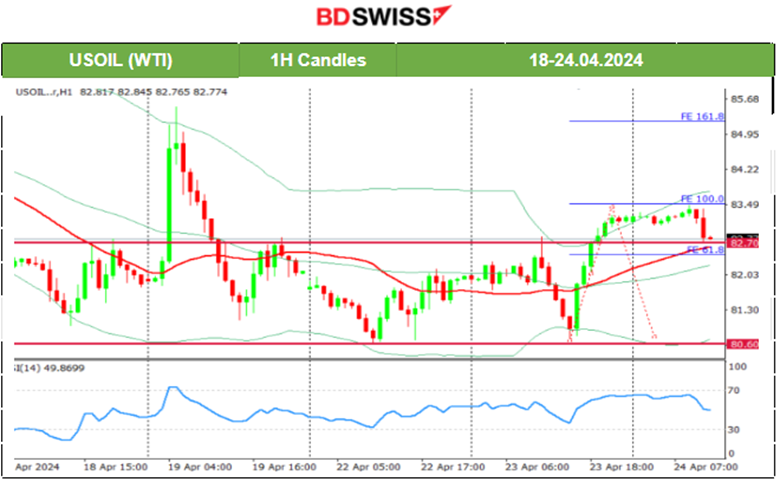
USOIL (WTI) 4-Day Chart Summary
Server Time / Timezone EEST (UTC+03:00)
Price Movement
On the 19th of April the news regarding the Israel attack in Iran, caused the commodity prices (Gold and Oil) to jump but only to reverse soon after fully. Currently, lower volatility levels form a triangle formation, and a breakout to the upside (which is possible considering the apparent bullish divergence) could lead the price to reach the 83.5 USD resistance. The 50-period Bollinger Band’s upper band supports the possible next target resistance to be at that level. Crude oil’s volatility could help the price to reach even the 85/b level which acts as a resistance level during this period. That could only be supported if the 82.7 USD/b level acts as an uptrend support now.
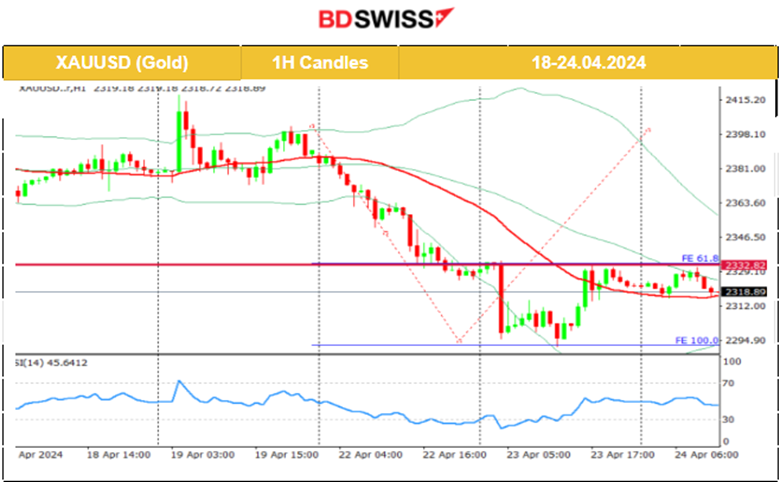
 XAUUSD (Gold) 4-Day Chart Summary
Server Time / Timezone EEST (UTC+03:00)
Price Movement
On the 17th of April Gold moved lower as it broke the apparent upward wedge formation reaching the intraday support at 2,355 USD/oz before returning to the 30-period MA. On the 18th of April, Gold stayed in range, flirting with the 2,390 USD/oz at some point but remaining close to the MA. On the 19th of April the news regarding the Israel attack in Iran, caused the commodity prices (Gold and Oil) to jump but only to reverse soon after fully. Gold retreated eventually lower reaching the support at 2,350 USD/oz. On the 22nd the downside path continued aggressively and today it even reached support at 2,300 USD/oz. That eventually acted as a turning point to the upside and a retracement to 2,330 USD/oz, close to the MA.
 ______________________________________________________________
News Reports Monitor – Today Trading Day (24 April 2024)
Server Time / Timezone EEST (UTC+03:00)
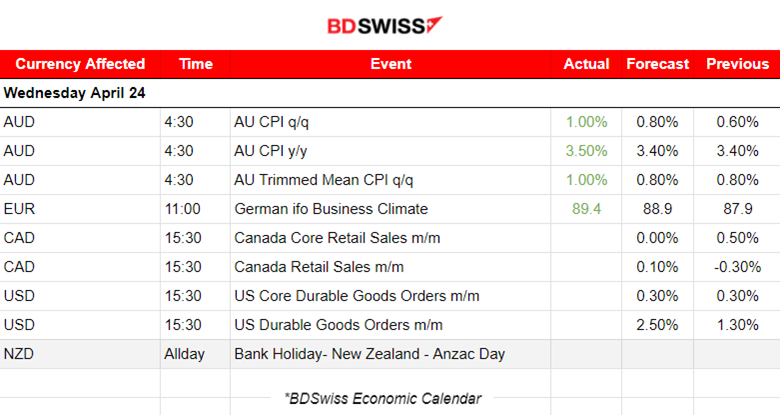
Australia’s inflation report showed that the monthly CPI indicator rose 3.5% in the 12 months to March. The annual figure was reported higher at 3.5% from 3.4% which was steady for 3 readings in a row. The AUD appreciated at the time of the release. AUDUSD jumped near 30 pips before retracement took place back to the 30-period MA.
Canada retail sales figure release might have a great impact on the CAD pairs. The expected core and normal figure have different directions. The core monthly change is expected to drop to 0% instead of rising like the normal figure. On a monthly basis Canada’s inflation is rising, according to the past 3 readings.
The U.S. Durable goods figure releases at 15:30 could have a big impact on the market with USD pairs to be affected by a moderate intraday shock. These are expected to be reported higher since the U.S. economy looks to get stronger this year.
General Verdict:
______________________________________________________________
 Marios Kyriakou
Posted on 02 May, 2024 at 15:07 GMT
Posted on 30 April, 2024 at 15:15 GMT
Posted on 29 April, 2024 at 11:59 GMT