BDSwiss App
Download & start trading

Rates as of 05:00 GMT
Market Recap
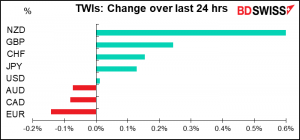
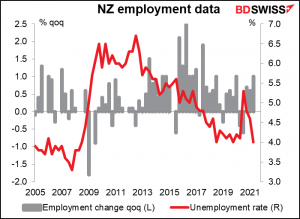
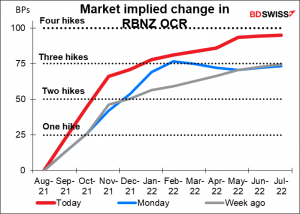
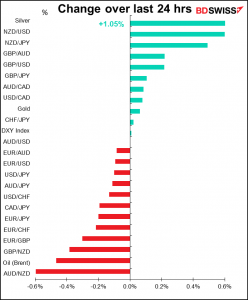
Monday it was AUD, Tuesday it was NZD’s turn to dominate the market. The markets were already in the mood to buy NZD following the Reserve Bank of New Zealand (RBNZ)’s announcement that it would consider both tighter macroprudential measures on mortgage lending and when to raise rates back to normal at its meeting in two weeks (Aug. 18th). Then came better-than-expected employment data. The unemployment rate fell by much more than expected as employment increased by much more than expected. Wages also rose faster than expected, which suggests inflationary pressures down the road.
At 4.0%, the NZ unemployment rate is now below the 2019 average and equal to the lowest it’s been since 2008.
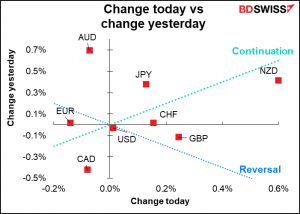
As a result, the market moved up its expectations of when the RBNZ might start normalizing policy and also how far it might go – it’s now pricing in a fourth rate hike over the next year. This move may well have legs, in my view.
Elsewhere, it was a “Goldilocks” day as pandemic fears receded and the S&P 500 moved further into record territory, while Treasury yields ended the day slightly lower across the curve. Markets were weak as the US day started, with Treasury yields, S&P 500 futures, and oil prices all sharply lower. The turnaround seems to have coincided with the release of US factory orders and the final figure for durable goods – factory orders were higher than expected and durable goods were revised up. This continued a recent string of strong US data, including real consumption, consumer confidence, and retail sales, as well as inflation.
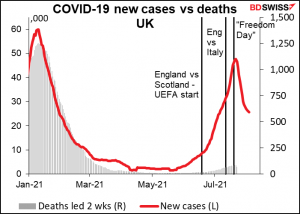
One reason the pandemic fears may have receded – and why GBP outperformed – could be the continued decline in UK virus cases. As I mentioned yesterday, it wasn’t so long ago that serious people thought 100k cases a day was “nearly inevitable” in the UK and 200k possible – and yet the latest 7-day average is 25,715, down 21% from a week ago. It looks like the spurt of new cases may have been caused in part by any number of “super spreader” events as people gathered to watch England play in the Euro 2020 games. It’s also significant that following “Freedom Day” on July 19th, when all restrictions were lifted, the number of new cases has not exploded as many expected but rather has declined steadily. This surprising performance has given hope that other places suffering from an outbreak of the delta variant, such as the US, can expect the virus to burn itself out a month or two after making its appearance.
Today’s market
Note: The table above is updated before publication with the latest consensus forecasts. However, the text & charts are prepared ahead of time. Therefore there can be discrepancies between the forecasts given in the table above and in the text & charts.
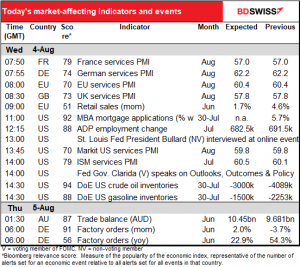
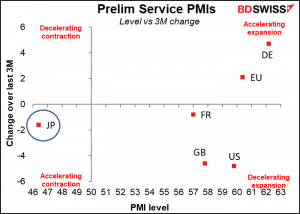
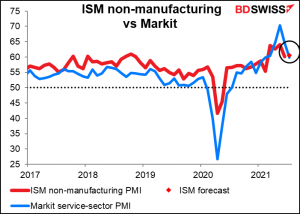
Monday it was the manufacturing purchasing managers’ indices, today it’s the service sector (and the composite) indices.
The preliminary figures showed all the major countries well into expansionary territory, although several were down from three months ago, indicating that their expansion is decelerating somewhat. The outlier of course is Japan, where the service sector has yet to enter expansionary territory since the pandemic began. (The Japan figure was revised up this morning to 47.4 from 46.4.)
The US Institute of Supply Management (ISM) version of this report is expected to rise slightly, in contrast to the Markit version, which was down by 4.8 points during the month. But since they’re both at about the same level (forecast 60.5 for the ISM vs 59.8 for the Markit) I’m not sure this is significant. Either way they show continued strong expansion.
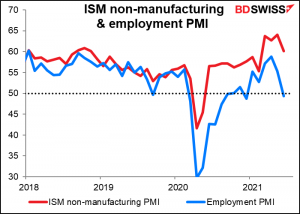
People always pay attention to the ISM service-sector employment PMI (no forecast available). Given that some 84% of US private-sector nonfarm employment is in the service sector, this is a key piece of the puzzle. The fact that the index fell slightly into contractionary territory last month (49.3) is worrisome for the labor market.
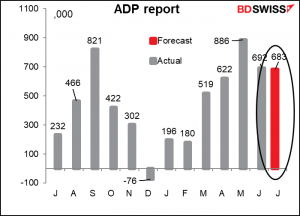
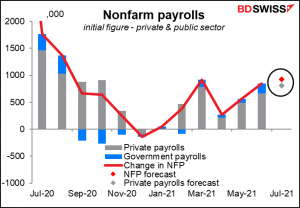
The big event of the day is the ADP employment report. Automated Data Processing Inc. (ADP) is an outsourcing company that handles about one-fifth of the private payrolls in the US, so its client base is a pretty sizeable sample of the US labor market as a whole. It’s therefore watched closely to get an idea of what Friday’s US nonfarm payrolls (NFP) figure might be. One point to note: the ADP adjusts its figures to match the final estimate of the NFP’s reading on private payrolls. It is therefore two steps removed from the headline figure that everyone focuses on, which is the initial figure for total payrolls, including government workers. So while it’s one of the best guides to the NFP that we have, it’s not perfect by any means – in fact, neither is the NFP figure itself, since it’s always revised.
Here’s how the two have differed in recent months. This year the ADP report has been anywhere from 404k over the NFP private payrolls figure to 285k below (+185% to -61%). That’s a pretty bad track record. To make matters worse, it’s not consistent. If it were always higher or always lower we could make adjustments for it. But the differences seem random.
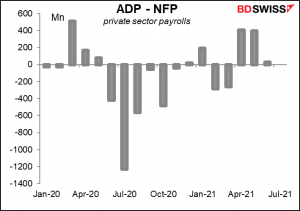
And remember that private payrolls are only a part of total nonfarm payrolls. This month the consensus forecast is for private payrolls to be up 808k (that’s the number you should compare the ADP forecast with) and for total payrolls to be up 925k.
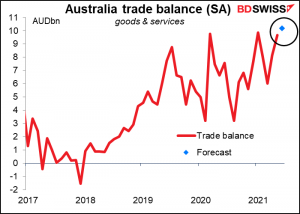
Overnight, Australia’s trade surplus is forecast to hit a new all-time record high (ignoring the fact that of course every record high is new and all-time. I just wanted to write that once. I promise I won’t do it again.) The country’s trade account has been in surplus from the start of 2018.
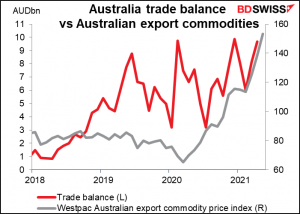
Much of the improvement is due to rising commodity prices. Export earnings are estimated to have risen 5.5% mom (vs +3.6% for imports) thanks to higher earnings from exports of iron ore, coal, gas, and gold. According to Westpac’s export-weighted index of Australian commodity prices, the country’s commodities rose 10.6% on the month. Coal was up 18.3%, iron ore 5.1%.
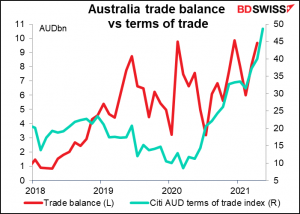
Rising commodity prices mean Australia’s terms of trade have improved considerably and that’s been supporting the trade surplus – and AUD.
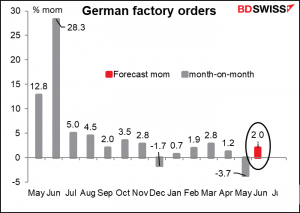
German factory orders are expected to be up mom, following the first down month this year, as global demand firms up.
Just before you go…
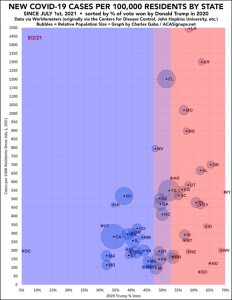
I would like to present this graph, which I found on Twitter yesterday. It may help people outside the US to understand what’s going on there with regards to the virus. Then again, I gather there are a lot of people in other countries too who are resisting getting the vaccine for whatever reason.
By the way, Florida (FL) doesn’t have that many Trump voters but it does have a very pro-Trump governor who’s avoiding taking any restriction measures, such as mask mandates or lockdowns, in order to position himself to get the Republican nomination for President in 2024.
 Marshall Gittler
Posted on 30 April, 2024 at 15:15 GMT
Posted on 29 April, 2024 at 11:59 GMT
Posted on 26 April, 2024 at 14:04 GMT