BDSwiss App
Download & start trading

PREVIOUS TRADING DAY EVENTS – 23 March 2023
Announcements:
Source: https://www.snb.ch/
Source: https://www.bankofengland.co.uk/
Source: https://www.dol.gov/
Source: https://www.cnbc.com/
______________________________________________________________________
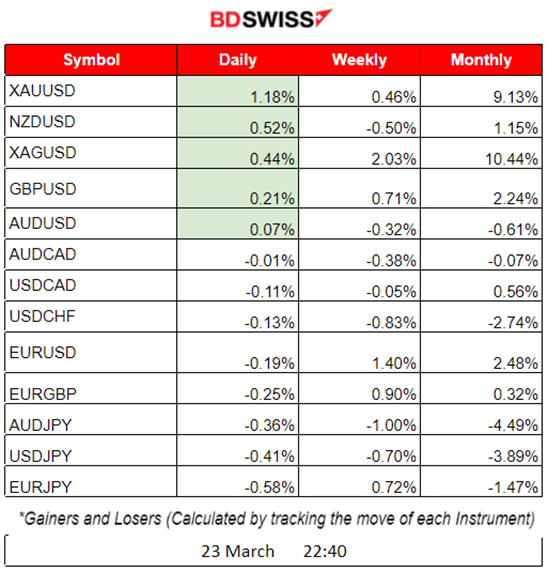
Summary Daily Moves – Winners vs Losers 23 March 2023
News Reports Monitor – Previous Trading Day 23 March 2023
Server Time / Timezone EET (UTC+02:00)

No important figures/release> No major impact.
At 10:30 the SNB policy rate figure was released at 1.5% as expected. The central bank hiked interest rates for the fourth time in a bid to contain inflation. The market experienced an intraday shock and volatile moves on both sides during that time for the CHF pairs.
At 14:00 the bank rate figure was released. The BOE decided to increase the bank rate by 0.25 percentage points, to 4.25%. UK rates are now at the highest level since October 2008. At the time of the release, the GBP pairs experienced volatility but no major upward/downward moves. The shock was not great since the rate figure was released as expected.
The number of individuals who filed for unemployment insurance for the first time during the past week appeared to be 191K for the US. This is a lower-than-expected number which is good for the economy and the currency. However, the impact on the USD pairs was not great. This figure is roughly the same positive figure for 2023 and unless we see a huge surprise and big deviation from the current figures, we will not witness any significant impact on the market.
General Verdict:
– The market experienced intraday shocks and volatility from the SNB policy rate release. Some volatility was observed when the BOE’s rate was released.
– The world has its eyes fixed on how the US is addressing the current banking crisis in combination with the rate hikes, creating a risk-off environment.
______________________________________________________________________
FOREX MARKETS MONITOR
EURUSD 4-Day Chart Summary
Server Time / Timezone EET (UTC+02:00)
Price Movement
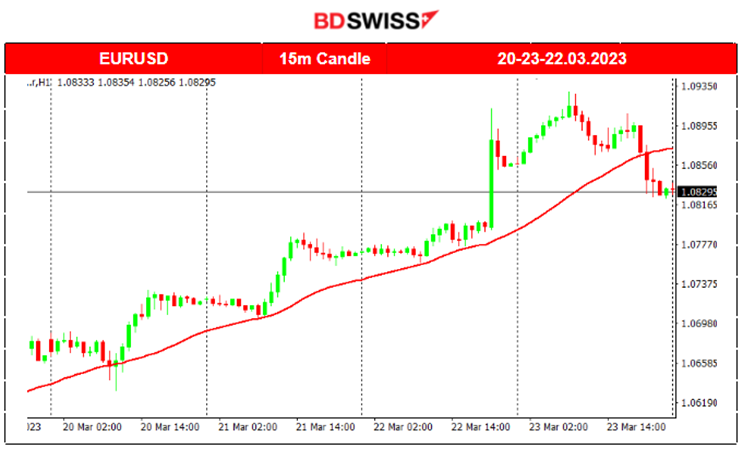
The EURUSD was following an upward trend for the past few days and this is clearly visible on the chart while the price moves always above the 30-period MA. A shock occurred on the 22nd of March (Fed Decision for Rate Hike) which caused the EURUSD to move further upwards rapidly. As we notice, this had a lasting impact. The market did not just retrace but rather a reversal took place. After breaking significant intraday support levels, the pair moved below the MA, probably signalling the end of the upward trend.
EURUSD 23.03.2023 Chart Summary
Server Time / Timezone EET (UTC+02:00)
Price Movement
The pair was moving upwards during the Asian session and started to show some volatility when it was close to 9:00 (GMT+2) as it was approaching the European Markets’ opening. At that time it was the end of the upward movement and the pair moved rapidly downwards, below the 30-period MA. After this price reversal, the price retraced about 50% of the move as shown by the Fibonacci Retracement levels. The pair moved further down again with the price reversing below the MA and breaking the intra-day support of the Fibo 100% level reaching to 161.8% level.
Trading Opportunities
Fibonacci Expansion can help in identifying the retracement level of 61.8% and 50% as per the chart. Price reversals are supporting the retracement opportunity. Hence, when the pair moves above the MA, crossing it and then moving below it with a sudden and rapid movement, this is a good sign for retracement as per the chart.

______________________________________________________________________
USDJPY 4-Day Chart Summary
Server Time / Timezone EET (UTC+02:00)
Price Movement
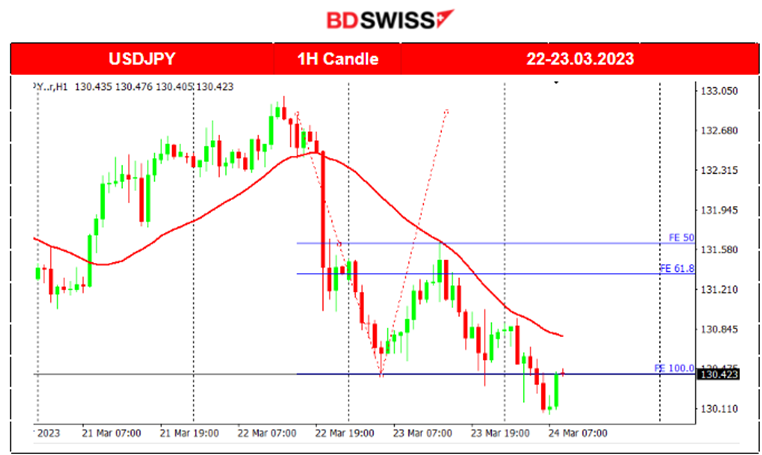
The USDJPY pair has been moving around the 30-Period MA for the past few days with no clear medium-trend upwards or downwards. Max deviations from the MA were about 160-180 pips showing high volatility. The FED decision on the 22nd of March caused the pair to move below the MA heavily and rapidly downwards. After that event, it started moving eventually below the MA, finding support at 130.420 price level.

USDJPY 23.03.2023 Chart Summary
Server Time / Timezone EET (UTC+02:00)
Price Movement
The pair experienced volatility during the day. After the previous day’s (22nd March) announcements and rate hike, the pair moved first downwards, upwards and then downwards. This is because the previous day’s intra-day shock ended downwards but that wasn’t the end of the whole price movement. On the 23rd of March, the drop continued to find the end of it at 130.420 support. Afterwards, a retracement was expected to take place.
Trading Opportunities
Considering that at the 130.420 level, the FED rate shock ended, the Fibonacci expansion could be used to identify the retracement levels and, thus, go long to capture it until the 61.8% level.
Our Technical Analysis here: https://www.tradingview.com/chart/USDJPY/vLxgTB9O-USDJPY-Might-Retrace-23-03-2023/
______________________________________________________________________
EQUITY MARKETS MONITOR
S&P 500 4-Day Chart Summary
Server Time / Timezone EET (UTC+02:00)
Price Movement
The S&P 500, is a stock market index tracking the stock performance of the 500 largest companies listed on stock exchanges in the United States. We observe how the index was recently moving upward following the announcements of the US to safeguard deposits and calm investors. On the 22nd of March though, we see that FOMC and FED rate news brought the index down causing volatility. More volatility occurs in the following days while the price moves around the 30-period MA. Deviations are max around 50-60 USD from the MA.

S&P 500 23.03.2023 Chart Summary
Server Time / Timezone EET (UTC+02:00)
Price Movement
The price of the index was moving within a range, showing low volatility. This is something to expect since the US indices move heavily usually after the New York Stock Exchange opening. The index followed a volatile path with no clear trend as it moved around the 30-Period MA.
Trading Opportunities
The index price is expected to follow this known volatile path with large moves upward and downward as more important announcements are taking place regarding bank rates and government steps to counter the banking crisis. Retracements are expected after the price crosses the MA as long as no clear medium trends are observed.

______________________________________________________________________
COMMODITIES MARKETS MONITOR
USOIL (WTI) 4-Day Chart Summary
Server Time / Timezone EET (UTC+02:00)
Price Movement
US Crude Oil price has been rising the past few days while moving above the 30-Period MA when suddenly on the 23rd of March it dropped below the MA. During the previous day, the Inventory figures showed a positive change, however, prices were pressured by comments made by chair Jerome Powell about credit risks in the banking system of the country on the 22nd of March. On the 23rd of March, at 17:30, the price dropped from the 71.6 USD level significantly causing the price to eventually move below the MA and then below the psychological level of 70 USD.

USOIL (WTI) 23.03.2023 Chart Summary
Server Time / Timezone EET (UTC+02:00)
Price Movement
Crude Oil price moved within a range during the Asian Session. Low volatility was observed until the European Market opening. The price moved upwards and during the afternoon was reversed. Oil Prices will continue as it seems to experience volatility caused by oversupply and economic uncertainty with no clear trends. This means that moving around the 30-period MA and the 70 USD level is more probable at the moment.
Trading Opportunities
The market experiences volatility from the uncertainty caused by the US Bank’s failures and the steps taken by the US to rectify it. Looking for reversals and retracement opportunities is more logical.

______________________________________________________________
News Reports Monitor – Today Trading Day 24 March 2023
Server Time / Timezone EET (UTC+02:00)
No important figures/release> No major impact.
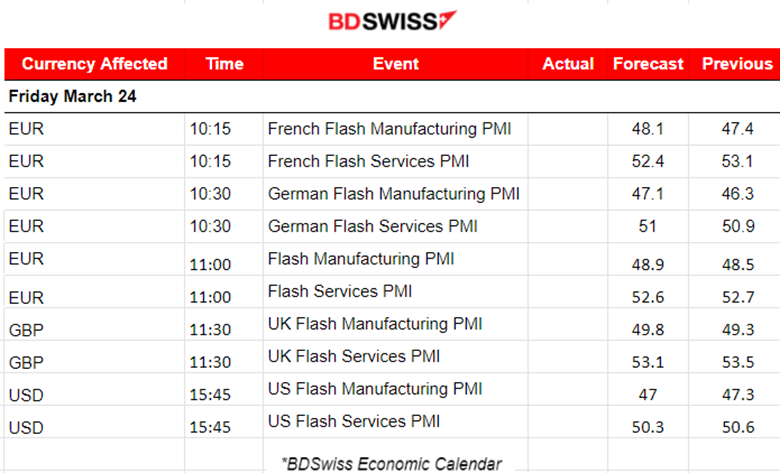
The day is dedicated to PMI figure releases for the UK, Eurozone and the US. Usually, we observe volatility in all major pairs. Since these releases take place during the European session it is expected that intraday trends will be formed after 9:00-10:00 am. EURUSD, GBPUSD and USDJPY will probably deviate from the MAs with over 20-30 pips deviation.
General Verdict:
– Manufacturing PMIs remain below 50 for all, UK, Eurozone and the US. The expectations are still to remain low. Any surprises could cause even further market volatility when the figures are released.
– Eurozone Services PMIs for these economies are above 50 showing that the industry might have gotten out of contraction, even though it is expected that the figures will remain close to the previous ones. No further expansion is expected.
– The impact on the forex pairs will be higher volatility than normal.
______________________________________________________________
 Marios Kyriakou
Posted on 25 April, 2024 at 15:14 GMT
Posted on 24 April, 2024 at 15:53 GMT
Posted on 23 April, 2024 at 11:46 GMT
Posted on 22 April, 2024 at 14:46 GMT
Posted on 19 April, 2024 at 13:15 GMT